
The air quality in Tri-Cities has been poor for the past several days due to wildfires.
When I opened the door Sunday morning, I instantly smelled smoke. On Saturday, I was able to join my friends on their pontoon to enjoy Water Follies action. It was fairly smoky on the Columbia River, as well. The good news, is that there’s a map you can check for air quality in your area.
The Washington Department of Ecology has a new map with real-time updates.
WA Department of Ecology
WA Department of Ecology
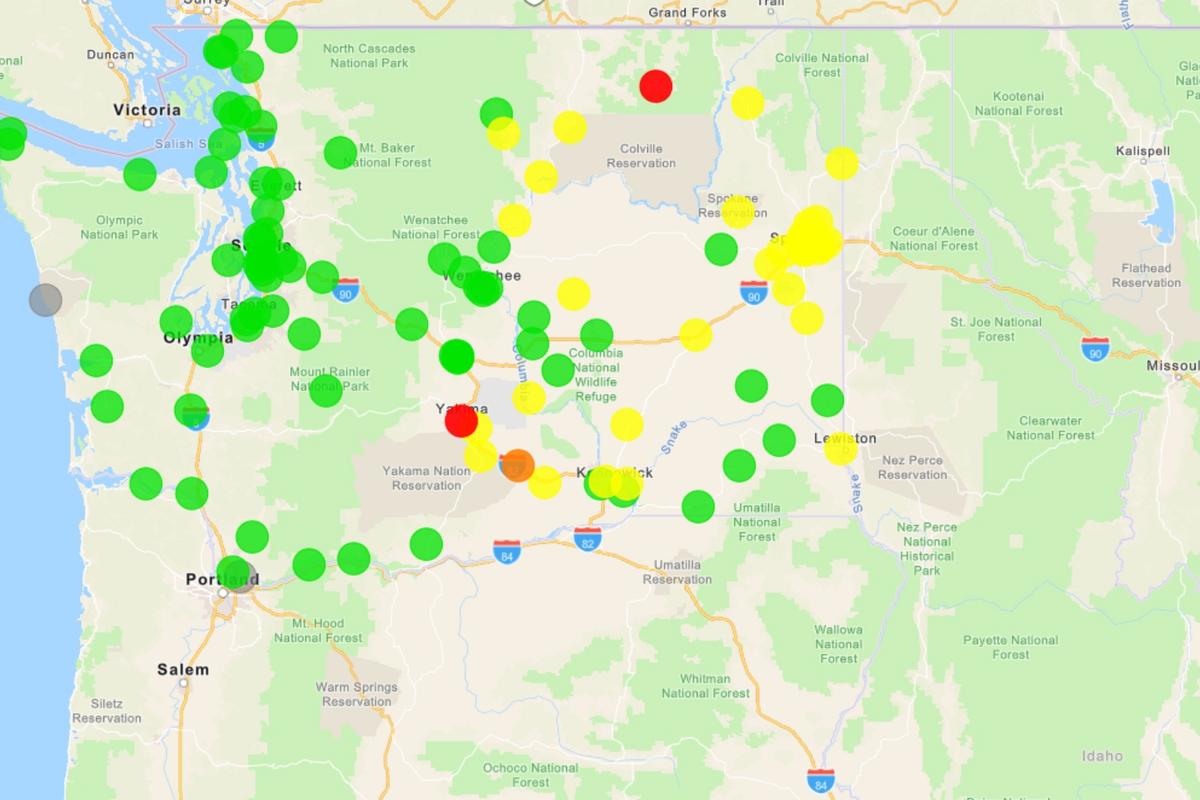
The air quality monitoring map has been updated to show smoke, ozone, and carbon monoxide all across the Evergreen state. The map can be viewed on a desktop and smartphone.
And, if you’re planning an event, you can check air quality 5-days ahead.
“Providing accurate and reliable air quality information is a key service we provide to the people of Washington,” said Kathy Taylor, manager of Ecology’s Air Quality program. “Now we have added more information to our interactive air quality map and made it even easier to access, so everyone can protect themselves from the dangers of smoke and other forms of air pollution.”
As wildfire smoke continues to affect us into August and September, you can check the enhanced map in real-time from anywhere at any time.
The map draws the most accurate and real-time data available from the state’s network of more than 80 air quality monitoring stations, providing a color-coded guide to pollution levels based on the national Air Quality Index (AQI).
You can download the air quality map HERE.
Photos From the Rimrock Retreat Fire, Yakima County, Washington!
These pictures, courtesy of Brian Siekawitch, give a brief but impactful look at the front lines, including the preventative steps being taken by the fire crews and some of the devastation the fire has caused.
Gallery Credit: tsm/Timmy!
Feeling Thirsty? How to Stay Hydrated During Extreme Heat
Don’t’s For Your Washington State Summer
Be cautious, stay hydrated, and don’t do the following things.
Gallery Credit: Aly
LOOK: The most extreme temperatures in the history of every state
Stacker consulted 2021 data from the NOAA’s State Climate Extremes Committee (SCEC) to illustrate the hottest and coldest temperatures ever recorded in each state. Each slide also reveals the all-time highest 24-hour precipitation record and all-time highest 24-hour snowfall.
Keep reading to find out individual state records in alphabetical order.
Gallery Credit: Anuradha Varanasi
Images are for reference only.Images and contents gathered automatic from google or 3rd party sources.All rights on the images and contents are with their legal original owners.
Comments are closed, but trackbacks and pingbacks are open.